The Economics and Demography of American Architects
The Good Oil
We often get questions about the standing of the profession. These emails express a concern that architects' incomes have been falling for several decades. They also worry about a general decline in respect and authority for the architect.
Are our correspondents right? Are architects being disrespected? How much do architects earn? On this page we present some economic and demographic data for the American profession. As far as we know, this is the first time that such historical data has been obtained, analysed and presented. You're looking at a world first!
The reality, alas, is difficult to find. We here at Architectural Blatherations have been investigating the economic and sociological standing of the profession for more than 25 years. It's all a mess, really. As you can see below, different sources give quite different results.
Note Along with the rest of this site, this page ceased updating in 2014. No further results will be published.
Our sources
We are happy for any reader to point us to better sources, but so far we are using these:
- The Economic Census (Professional, Scientific and Technical Services) (EC), conducted every five years by the U.S Census Bureau. We have data from this census going back to 1967 (when it was known as the Census of Service Industries); quite a while. Here is what we found.
- The Current Population Survey (CPS), a joint project of the U.S. Census people and the Bureau of Labor Statistics (BLS) in the U.S. Dept of Labor
- The National Compensation Survey (NCS) conducted by the BLS.
- The Occupational Employment Statistics (OES) program, also by the BLS.
- We also use the Survey of Registered Architects by the National Council of Architectural Registration Boards (NCARB).
How many American architects are there?
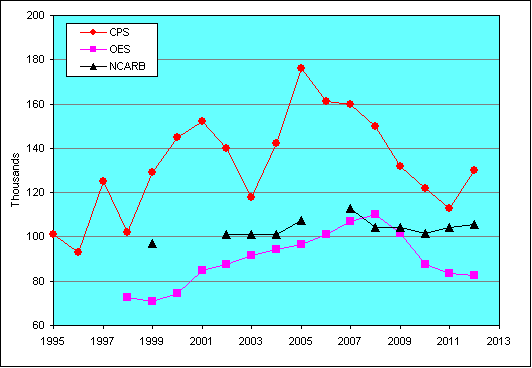
That depends who you ask. The chart below shows data from three sources. In theory, NCARB's should be the best indicator, but we wouldn't trust them to run a chook raffle. And there are many people who do the work of architects, who have the right qualifications, but who are not registered. The best we can say is that there are 80,000 to 110,000 architects in the United States.

Not rare birds any more
We suspect that much of the feeling of malaise in the occupation arises not from economic realities, but from social ones. Quite simply: many years ago, there were very few architects in the USA, and they were very special people. Nowadays you can find any number of architects busking in subways. Not so special!
Here's what we mean. Take a look at the chart below, which shows the number of architects in the United States in terms of architects per million Americans. We use data from the US Census because it goes so far back.
In 1850, 17 Americans in every million were architects: rare birds indeed. In 1850 an American architect would travel in a fine carriage to his rich client's abode, while most Americans walked to work.
Through 1910–1960 the proportion increased: this is the period during which the American professions as we know them today were created. Then a plateau so that in 1960, 166 Americans in every million were architects. But take a look at what happens in the decades after 1960: by 2010 almost 700 in every million were architects.
By 2010, there were as many architects in the USA as there were ushers, lobby attendants or drywall installers (source: OES). And now the architects—and the ushers, lobby attendants, and the drywall installers— all drive to work. If architects were as rare today as were in 1850, today they would be as uncommon as professional mathematicians or commercial divers (that's divers, not drivers).
It may be that the feeling of malaise in the occupation has little to do with economics, and more to do with the sociological bloating of the occupation.

Economic data about American architects
Most economic data about architects (salaries, wages, compensation, etc) only looks at employees. That's fine as far as it goes, but architecture has traditionally been an occupation of the self-employed. According to the BLS screed on architects, one in five architects are (is?) self-employed, about three times the rate for other professionals. This huge segment does not show up in any of the data sources we at Architectural Blatherations have available.
Some of our sources use medians
, and some means
. Both are often referred to as
average
. You really should look up the difference. We prefer the median. Our sources also use
different time periods: hourly, weekly, or annual earnings. Why does this matter? Architects may earn a
high hourly rate, but if a typical contracting architect only works nine months a year, their
annual earnings may be the same as someone on a lower hourly rate who works twelve.
So we cautiously present our results for architectural employees. To eliminate the effects of inflation, we present our data as ratios to the incomes from other occupations.
Results from the National Compensation Survey (NCS)
The NCS charts the mean hourly earnings of wage and salary workers in the USA. In this chart, the mean hourly earnings for architects = 100.

Results from the Occupational Employment Statistics (OES) program
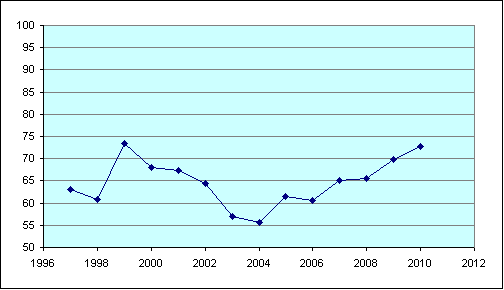
The OES lists the median annual wage for a very detailed breakdown of American occupations. We provide a few occupations here. In this chart, the median annual wage for architects = 100. We can't see any trends here: there is no evidence that architects' incomes have declined over the near-15 years since 1998.

Results from the Current Population Survey (CPS)
The CPS provides data back to 1995. The CPS lists median weekly earnings. In this chart, the median weekly earnings of architects = 100. Example: In 1995, the median weekly earnings of an American professional was 99% that of a typical professional worker. By 2011, the typical professional was earnign only 78% of the architectural worker. The evidence here is that American architects have improved their lot compared to other professsionals.

Our Conclusions
Regardless of what you measure, if anything architects' incomes have improved slightly since the mid- to late-1990s compared to other professionals; and are at about the same level compared to the income level of all workers.
Results from the Economic Census (EC)
We have been studying this data since 1967. Good heavens! We hope to present a full analysis by last quarter of 2015.
